This case study is for another such project where Operations Excellence highlighted the product for its high cost of poor quality.
Problem Statement: The process capability indicators Cpk, Ppk had been observed and Ppk of the product was seen as very less (<0.66). Product had repeated issues on the quality attribute “dissolution”. Previous investigation reports and CAPAs taken indicated the CAPAs are not effective, and issues continued to reoccur. This project was given to us to identify the real root cause of the issue.
We followed conventional Six Sigma Methodology and applied DMAIC steps. With Project Charter signed, as part of the methodology next steps were to get CTQ analysis, Process Map and Cause and Effect analysis done.
For this product the CTQs are measured at IP stage (in process) and FP (finished product stage). Compensation is done as per IP stage analysis.
The Investigation
In this case, the customer had an advanced data collection mechanism, a decent data engineering and an evolving data science team. Customer’s data lake collects all the CPP and CQA data which is called a Flat File. We made a conscious decision to use the software packages known to the customer as it obviously helps bring the teams on the same page with known interface and style of storytelling, which also shortens the investigation time.
A few initial reports were already available with the Operations Excellence liaison team. After examining the existing reports, we pulled in our data scientists to speed up the investigation and dig further to discover any hidden patterns by applying Machine Learning and AI models.
We took this Flat file and ran exploratory analysis through Visualization and Machine Learning Software that was also known to the customer. Our experts ran a few quick analyses that helped us in identifying potential causes for the variation. Further data collected was for all critical parameters and detailed analysis followed using the time series profiles of the CPPs (critical process parameters). Experts followed through with various ML models and validated them.
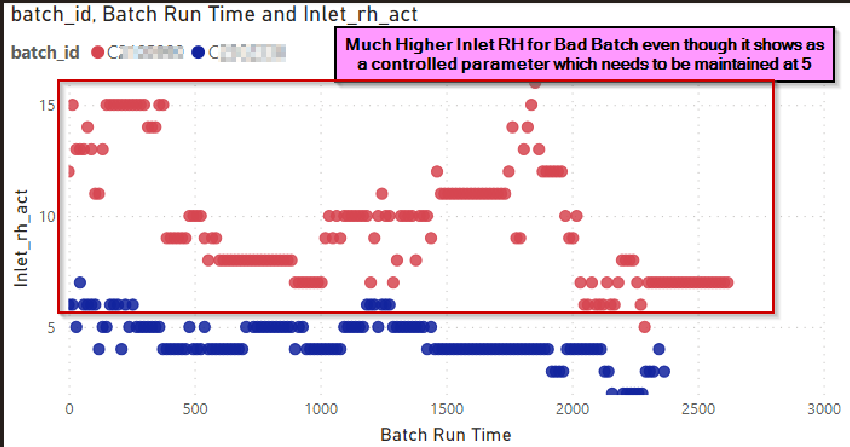
In this course of a few iterations of sifting through the data and posing new questions to the manufacturing team, the investigation allowed us to develop a special methodology. We applied this methodology to investigate the causes for variations and came up with the hypothesis that inlet RH at a key process step is a key CPP. The variation in inlet RH at this step is the root cause for the variation in dissolution. This hypothesis was validated against many other batches of data.
As a final step and recommendation, a new CAPA was proposed and implemented.
Result: After the CAPA implementation a marked difference in the mean value of CTQ was observed. The value was in the desirable range. The project has been appreciated by sr. production managers and technical teams.
Conclusion
Complementing Six Sigma investigations with automation, applied Machine Learning and AI can really speed up the phases of DMAIC.
Descriptive, Predictive, Prescriptive Analytics accompanied with appropriate Visualisation and Dashboarding can augment Process Quality and Results with quicker identification of variations, outliers and thus warranting necessary actions for the stakeholders.


